

Methodology
How Madini works
From raw satellite data to ranked exploration targets — every step documented, and backed by peer-reviewed methodologies where published methods exist.
Data Acquisition
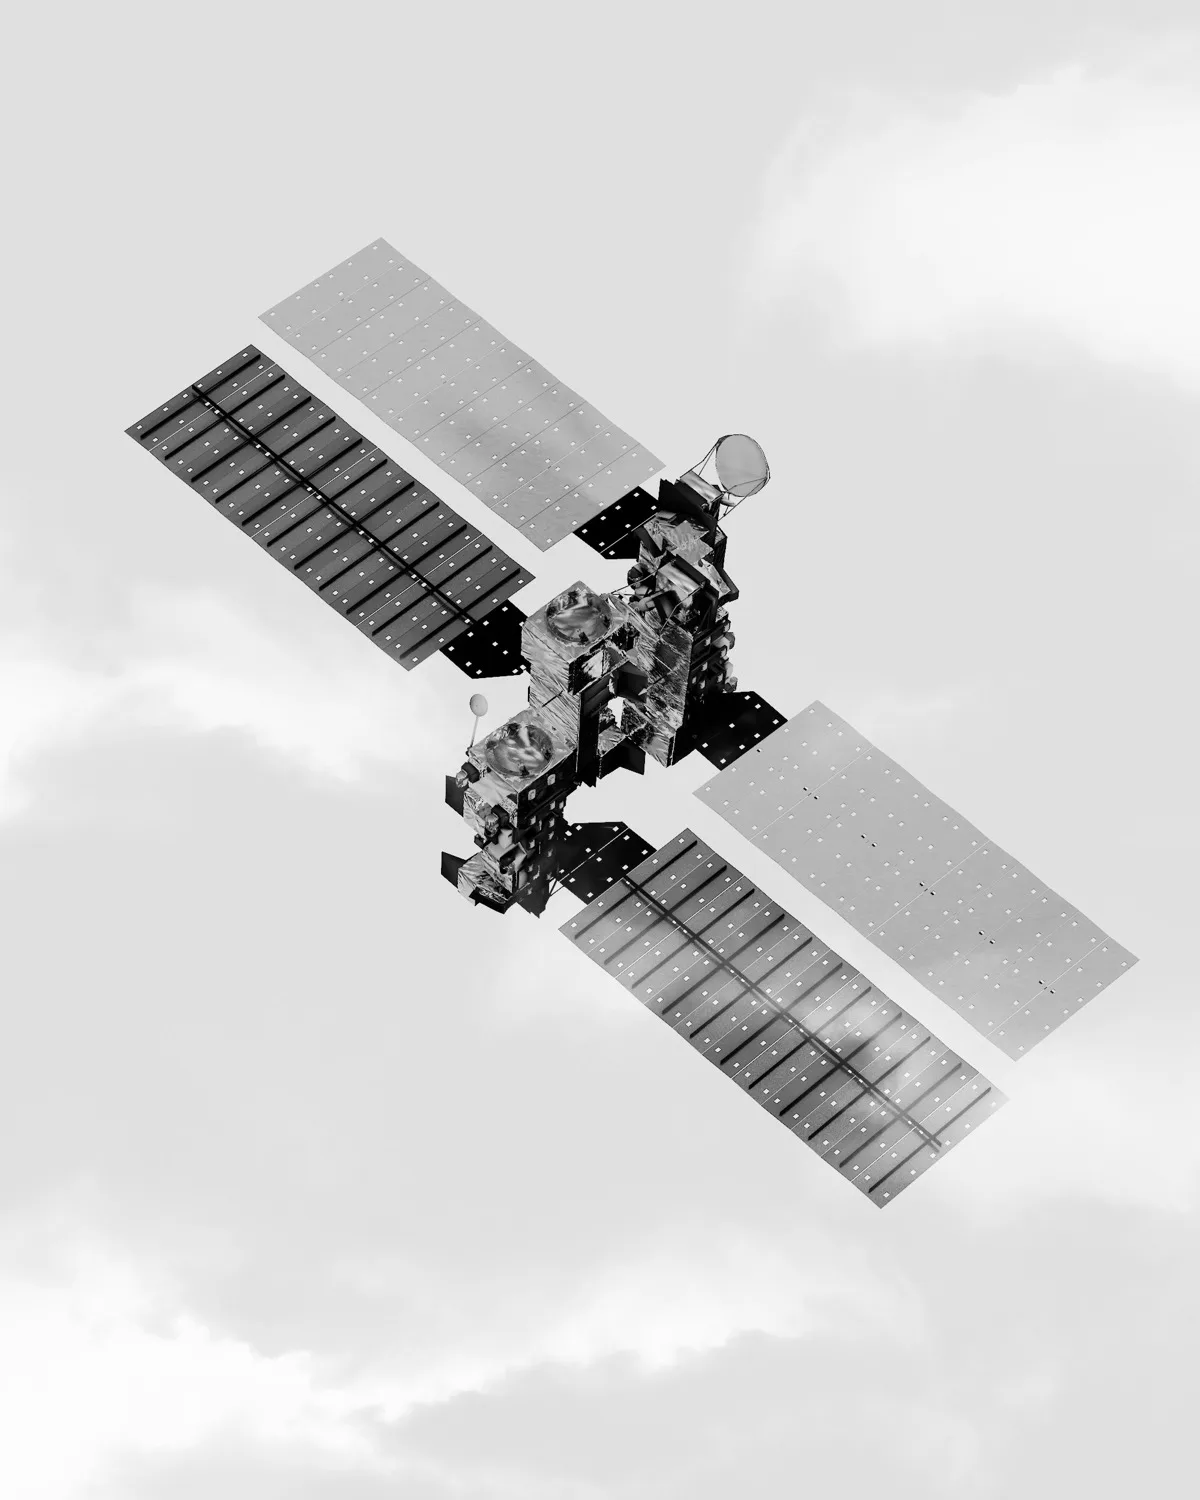
The moment you submit your region, we pull satellite imagery from Sentinel-2, ASTER, NASA EMIT hyperspectral, and SRTM elevation — automatically, no manual downloads or preprocessing needed.
- +Sentinel-2 L2A surface reflectance
- +ASTER L1T with SWIR crosstalk correction
- +EMIT L2B mineral abundance products
- +SRTM 30m elevation + slope + curvature
Spectral Analysis
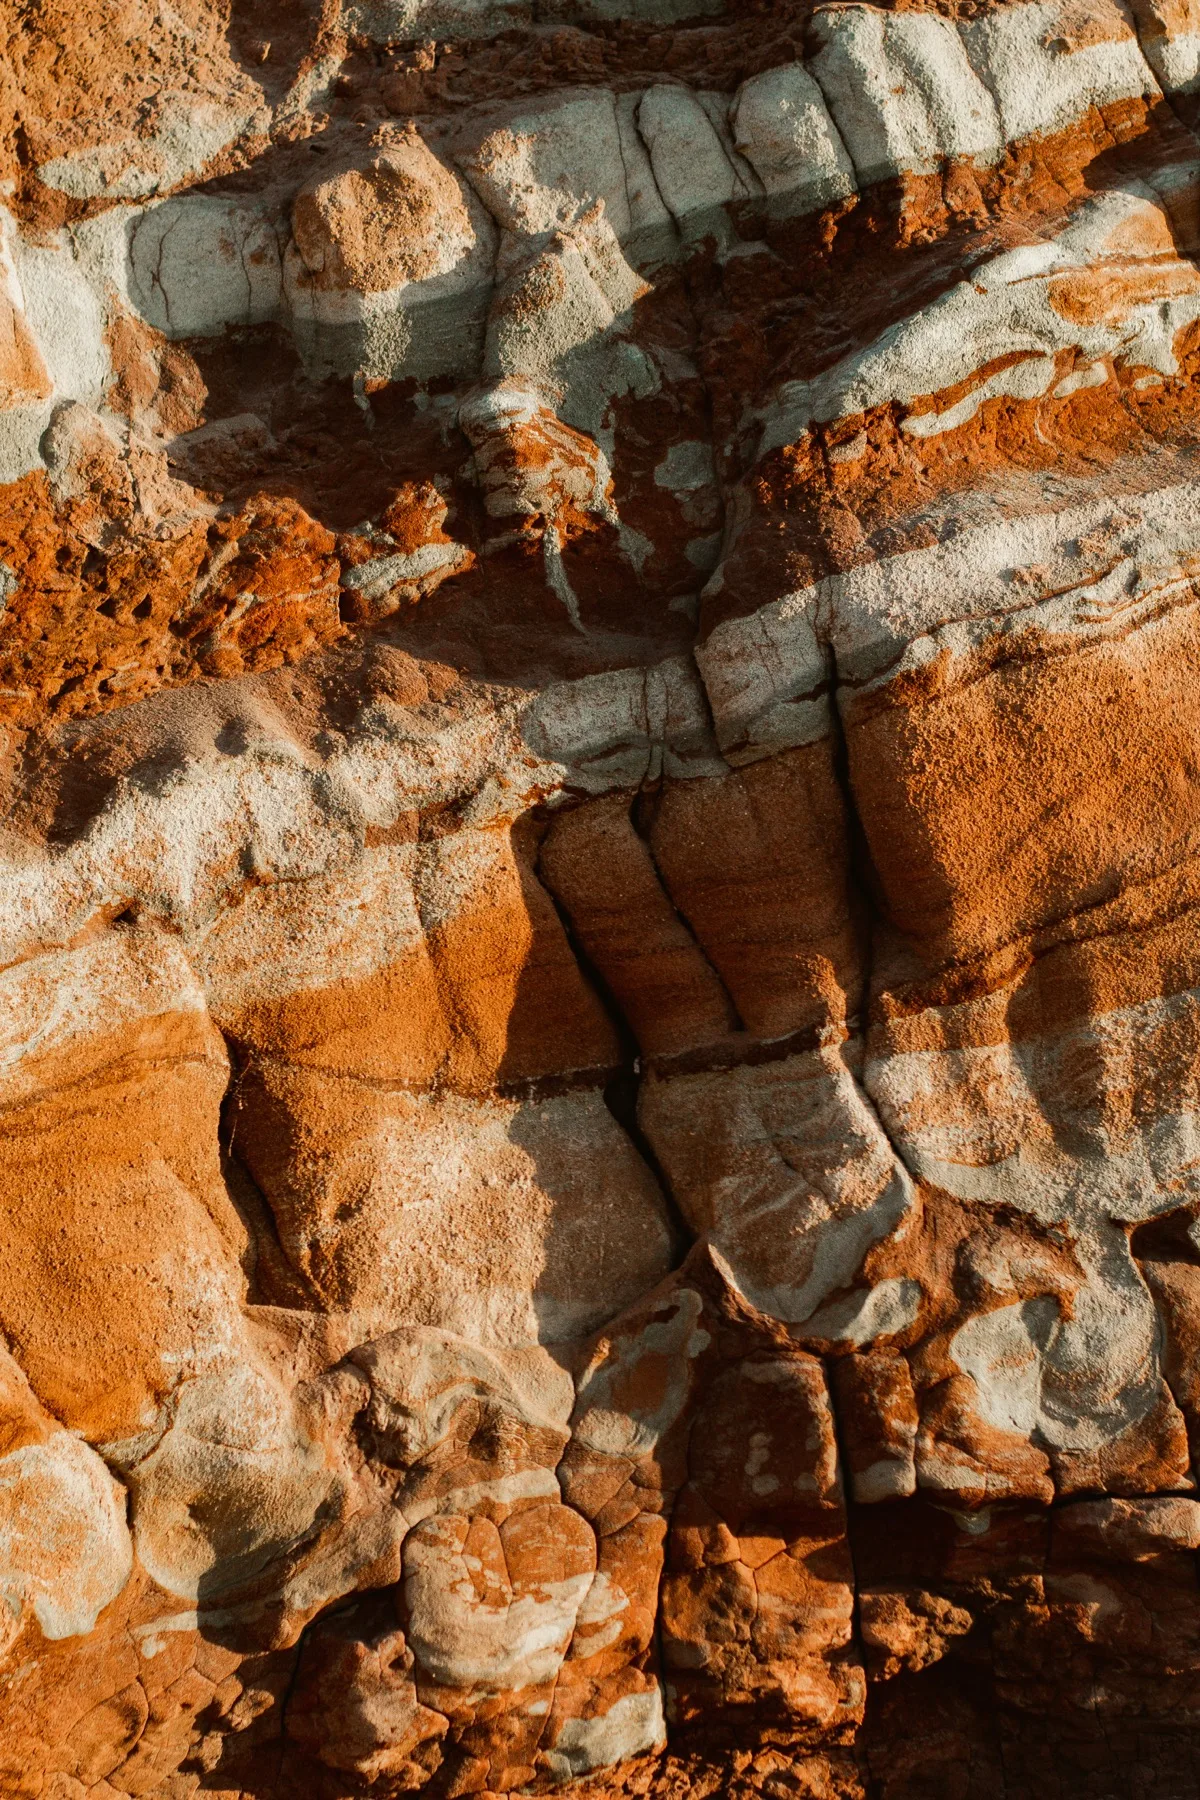
Band ratios and spectral indices reveal alteration mineralogy invisible on the ground. Iron oxide ratios detect gossans and laterite caps. Hydroxyl indices map clay-sericite-chlorite alteration zones.
- +Iron oxide (B4/B2) — Rowan et al. 1977
- +Hydroxyl (B11/B12) — Rowan & Mars 2003
- +ASTER sericite, chlorite, carbonate indices
- +EMIT mineral abundance at 2.2–2.5 µm

Structural Analysis
Structural features extracted automatically from elevation data. Multi-azimuth hillshade highlights lineaments, edge detection maps discontinuities, and curvature analysis identifies structurally complex zones.
- +8-direction hillshade (Horn 1981)
- +Sobel edge detection for lineaments
- +Slope variability analysis
- +Laplacian curvature at native 30m
Evidence Integration
All evidence layers combined using deposit-model-specific weights — a knowledge-driven ensemble of weighted linear combination and fuzzy logic. The weights come from the published deposit-model literature, not from training on your region.
- +6–7 deposit models per commodity, literature-derived weights
- +Weighted linear combination + fuzzy logic
- +Percentile classification (P70/P80/P90/P95)
- +ML enhancement exists but is not part of a standard analysis

Target Generation
High-prospectivity zones delineated into ranked exploration targets. Model–method agreement expresses how closely the separately computed deposit-model and integration-method estimates coincide. Those estimates share input evidence layers, so agreement among near-identical estimators is a property of the method, not a second opinion about the ground. It is not the probability that mineralisation is present.
- +Priority-ranked target polygons
- +Model–method agreement: how closely the model and method estimates coincided — not a probability
- +Contributing factor breakdown
- +Downloadable GeoJSON coordinates

Deliverables
Results packaged in formats your team already uses. Interactive web maps for immediate exploration. Publication-grade PDF reports for stakeholders. GeoTIFF rasters and GeoJSON target polygons for your GIS.
- +Interactive prospectivity web map
- +PDF scientific whitepaper (15-20 pages)
- +Multi-band GeoTIFF rasters
- +GeoJSON exploration targets

Peer-Reviewed References
Our methodology is built on established remote sensing science. Key references with DOI links:
- Rowan, L.C., Goetz, A.F.H., & Ashley, R.P. (1977). Discrimination of hydrothermally altered and unaltered rocks in visible and near-infrared multispectral images. Geophysics, 42(3), 522–535. DOI
- Rowan, L.C. & Mars, J.C. (2003). Lithologic mapping in the Mountain Pass, California area using Advanced Spaceborne Thermal Emission and Reflection Radiometer (ASTER) data. Remote Sensing of Environment, 84(3), 350–366. DOI
- Ninomiya, Y., Fu, B., & Cudahy, T.J. (2005). Detecting lithology with Advanced Spaceborne Thermal Emission and Reflection Radiometer (ASTER) multispectral thermal infrared "radiance-at-sensor" data. Remote Sensing of Environment, 99(1-2), 127–139. DOI
- Iwasaki, A. & Tonooka, H. (2005). Validation of a crosstalk correction algorithm for ASTER/SWIR. IEEE Transactions on Geoscience and Remote Sensing, 43(12), 2747–2751. Cited as background only: the ASTER SWIR crosstalk correction applied in this analysis is an in-house approximation of unverified fidelity, not an implementation of this paper’s algorithm or coefficients. DOI
- Horn, B.K.P. (1981). Hill shading and the reflectance map. Proceedings of the IEEE, 69(1), 14–47. DOI
Last updated: April 13, 2026
Ready to see it in action?
Create your account and submit your first analysis request.